Estimating Load Capacity and Test Throughput of Environmental Test Chambers for PV Modules-Part 2
Product description
Specifications
Download
Estimating Load Capacity and Test Throughput of Environmental Test Chambers for PV Modules - Part 2
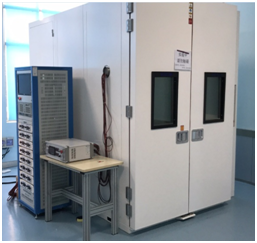
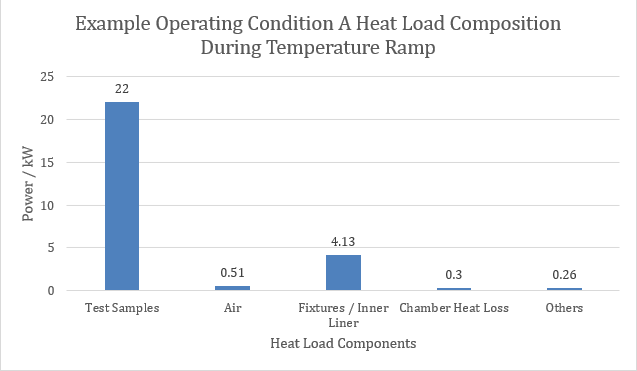
6. Example Operating Condition A
As an illustrative example, consider a high-low temperature test chamber with the following parameters (values are illustrative and do not represent a specific project):
Inner chamber size: 2.8 × 1.9 × 1.7 m
Airflow rate: approximately 7200 m³/h
Refrigeration system: cascade system (R404A + R23), nominal cooling capacity 30 kW
Target ramp rate: 3.3 ℃/min
Module parameters:
Size: 2600 mm × 1400 mm × 35 mm
Mass: approximately 37 kg
Specific heat: approximately 0.9 kJ/(kg·℃)
Equivalent heat capacity: kJ/℃
At 3.3 ℃/min, the heating/cooling power per module is:
For 12 modules:
Other estimated contributions:
Air: ~0.51 kW
Fixtures and inner chamber: ~4.13 kW
Door/window heat transfer: ~0.30 kW
Leakage and miscellaneous loads: ~0.26 kW
Total demand during ramp:
If the available cooling capacity after derating is kW, a shortfall of approximately 1.7 kW exists, indicating potential ramp-rate risk. Possible mitigation measures include reducing ramp rate, reducing loading quantity, or increasing effective cooling capacity through system optimization and airflow improvement.
7. Why Single-Module Tests Often Appear “Unstable”
During commissioning, it is common to observe that temperature curves appear less stable when only one or a few modules are loaded. When airflow is adequate and well organized, this typically results from excessive cooling capacity relative to the actual thermal load, making the control system prone to overshoot and oscillation.
Mitigation strategies include increasing the loading quantity to bring the system closer to its design load, or reducing cooling capacity or airflow while optimizing control parameters.
If airflow is insufficient or return-air short-circuiting exists, symptoms shift to slow cooling rates, stratification, and large local temperature differences. In such cases, airflow issues must be resolved before any control tuning or loading adjustments.
8. Three Practical Engineering Principles
To ensure practical applicability, three key principles are recommended:
Airflow before cooling capacity
An average working-zone airflow velocity of 0.5–1.5 m/s and proper return airflow are prerequisites for uniformity.Spacing before airflow increase
Maintaining module spacing of mm (for mm modules) is often more effective than simply increasing airflow.Dual-rate verification
Perform verification at both 1.67 ℃/min and 3.3 ℃/min, corresponding to standard compliance and capacity evaluation.
9. Engineering Application and Practical Value
9.1 For End Users
By combining and ramp rate, users can estimate batch size, test duration, and overall project timelines during equipment selection or project planning, enabling more accurate cost and resource assessment.
9.2 For Test Laboratories and Quality Departments
Laboratories can establish standardized capability tables for different chamber types and ramp rates, supporting scheduling, utilization analysis, and equipment expansion decisions.
9.3 For Equipment Suppliers
A clear and quantitative loading and throughput framework supports internal design verification, solution comparison, and continuous improvement through feedback from historical test data.
Conclusion
This article presents a reusable estimation framework applicable across different projects. By inputting key parameters such as chamber dimensions, airflow rate, ramp rate, module spacing, and derated cooling capacity into a unified set of equations, the recommended loading limit and corresponding test throughput can be derived.
By integrating loading quantity, ramp rate, cooling capacity, and airflow into a single calculation framework, many design and commissioning trade-offs become quantifiable. This also enables clear, traceable communication when discussing equipment selection and test scheduling with end users.
- File name Release date Ooperating